
這幾天天氣太冷了吧,腳也麻了,用暖爐也覺很冷,始終像一尊佛坐在工作台用電腦嘛,沒運動不冷才怪呢。
以下是安裝過程得到的一些經驗總結:
- 之前的安裝似乎未有 load balancer 服務,所以沒有方法連入 Cluster IP,目前只能夠靠
kubectl port-forward或 NodePort。見有文章用 MetalLB,可一試 - Dashboard 預設安裝在 worker node,而非 control-plain node,但可透過修改 yaml 安裝到control-plain node
- Linux Firewall 未完全掌握如何配合K8S,要麼先關掉繼續測試,要麼先掌握
好了,今天的目標是加在NAS中加一個K8S Node (k8s-node-2) 和 安裝 Web UI,let's go!
Setup the Worker nodes: 2
- 首先到NAS 打開 Virtual Station (我是用QNAP QTS5, TS-235D / 20GB RAM / PCIe NVMe SSD)
- Create Virtual Machine
- VM name: k8s-node-2
- OS: Linux
- OS Version: CentOS 7.4
- CPU: Core2 Duo
- CPUs: 1
- Memory: 2GB
- Harddisk: 20GB, New image
- Network: VirtIO, Main Switch
- CD / DVD Rom: IDE, CentOS-7-x86_64-Minimal-2009.iso
- Video card: VGA
- USB: USB 2.0
- Start VM, enter the CentOS installation
- Follow setup log from 在家搭建和測試 Kubernetes (1)
- No need to clone VM and follow worker node setup
- Join the cluster
- sucess and working, can see the node from
kubectl get nodecommand
- sucess and working, can see the node from
Adminstration Interface
還有時間,試一下安裝管理介面。
參考了這文章:Kubernetes客户端和管理界面大集合 - 知乎 (zhihu.com),現在多了很多管理介面工具,不過還是先從基本開始吧。
Kubernetes Dashboard
See: Deploy and Access the Kubernetes Dashboard | Kubernetes
In control-plain node, run:
# Deploy Kubernetes Dashboard
kubectl apply -f https://raw.githubusercontent.com/kubernetes/dashboard/v2.7.0/aio/deploy/recommended.yaml

# Check status
kubectl get pod -A
一來就FAIL了!看看問題:
[root@k8s-ctrl ~]# kubectl get pod -A
NAMESPACE              NAME                                         READY   STATUS             RESTARTS      AGE
kube-flannel           kube-flannel-ds-8f2td                        1/1     Running            1 (34m ago)   34m
kube-flannel           kube-flannel-ds-cngpt                        1/1     Running            1 (20h ago)   21h
kube-flannel           kube-flannel-ds-ktv8g                        1/1     Running            1 (20h ago)   21h
kube-system            coredns-5dd5756b68-2b4c5                     1/1     Running            1 (20h ago)   21h
kube-system            coredns-5dd5756b68-nzb2v                     1/1     Running            1 (20h ago)   21h
kube-system            etcd-k8s-ctrl                                1/1     Running            5 (20h ago)   21h
kube-system            kube-apiserver-k8s-ctrl                      1/1     Running            5 (20h ago)   21h
kube-system            kube-controller-manager-k8s-ctrl             1/1     Running            1 (20h ago)   21h
kube-system            kube-proxy-4dhcq                             1/1     Running            1 (20h ago)   21h
kube-system            kube-proxy-rrh9t                             1/1     Running            1 (34m ago)   34m
kube-system            kube-proxy-v2sgb                             1/1     Running            1 (20h ago)   21h
kube-system            kube-scheduler-k8s-ctrl                      1/1     Running            5 (20h ago)   21h
kubernetes-dashboard   dashboard-metrics-scraper-5657497c4c-bdp4b   1/1     Running            0             55s
kubernetes-dashboard   kubernetes-dashboard-78f87ddfc-gsjnw         0/1     CrashLoopBackOff   2 (8s ago)    55s

[root@k8s-ctrl ~]# kubectl -n kubernetes-dashboard logs kubernetes-dashboard-78f87ddfc-gsjnw
2024/01/25 12:42:44 Starting overwatch
2024/01/25 12:42:44 Using namespace: kubernetes-dashboard
2024/01/25 12:42:44 Using in-cluster config to connect to apiserver
2024/01/25 12:42:44 Using secret token for csrf signing
2024/01/25 12:42:44 Initializing csrf token from kubernetes-dashboard-csrf secret
panic: Get "https://10.96.0.1:443/api/v1/namespaces/kubernetes-dashboard/secrets/kubernetes-dashboard-csrf": dial tcp 10.96.0.1:443: connect: no route to host

goroutine 1 [running]:
github.com/kubernetes/dashboard/src/app/backend/client/csrf.(*csrfTokenManager).init(0xc0004dfae8)
        /home/runner/work/dashboard/dashboard/src/app/backend/client/csrf/manager.go:41 +0x30e
github.com/kubernetes/dashboard/src/app/backend/client/csrf.NewCsrfTokenManager(...)
        /home/runner/work/dashboard/dashboard/src/app/backend/client/csrf/manager.go:66
github.com/kubernetes/dashboard/src/app/backend/client.(*clientManager).initCSRFKey(0xc0000bc980)
        /home/runner/work/dashboard/dashboard/src/app/backend/client/manager.go:527 +0x94
github.com/kubernetes/dashboard/src/app/backend/client.(*clientManager).init(0x19aba3a?)
        /home/runner/work/dashboard/dashboard/src/app/backend/client/manager.go:495 +0x32
github.com/kubernetes/dashboard/src/app/backend/client.NewClientManager(...)
        /home/runner/work/dashboard/dashboard/src/app/backend/client/manager.go:594
main.main()
        /home/runner/work/dashboard/dashboard/src/app/backend/dashboard.go:96 +0x1cf
After checking, the problem is due to the firewalld service. If stop the work node's firewalld (note: control-plain firewalld does not affect) . The dashboard pod can be started successfully
Be also noted that the dashboard pod is created in worker node, not the control-plain node.
the following is the firewall list:
[root@k8s-ctrl ~]# firewall-cmd --add-port=443/tcp --permanent
[root@k8s-ctrl ~]# systemctl restart firewalld
[root@k8s-ctrl ~]# firewall-cmd --list-all
public (active)
  target: default
  icmp-block-inversion: no
  interfaces: ens33
  sources:
  services: dhcpv6-client ssh
  ports: 6443/tcp 6443/udp 10250/tcp 10250/udp
  protocols:
  masquerade: no
  forward-ports:
  source-ports:
  icmp-blocks:
  rich rules:
After adding port 443/tcp, the problem is solved.
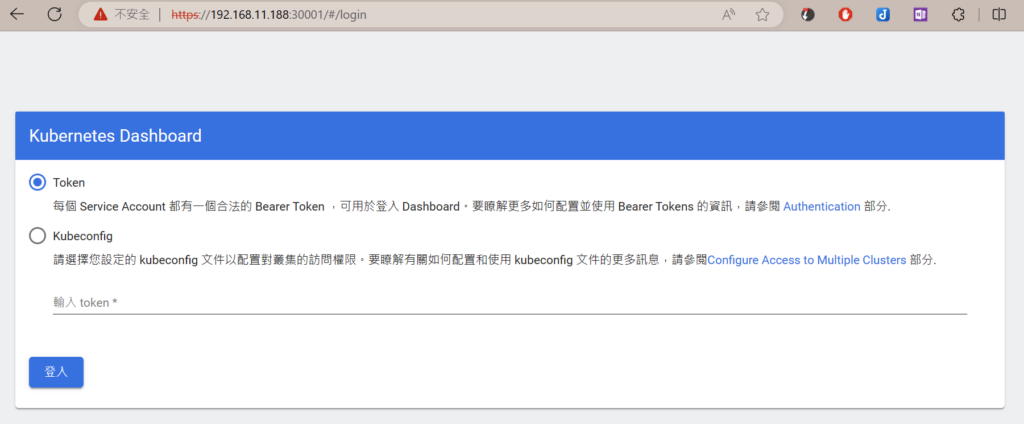
However, the dashboard cannot be accessed unless using port-forward without the load-balance setup (to be done later). It can be fixed by exposing it via NodePort. To do this:
# Download the dashboard yaml:
curl -O https://raw.githubusercontent.com/kubernetes/dashboard/v2.7.0/aio/deploy/recommended.yaml

# Edit the yaml, go to Service block, add
# type: NodePort
# and add nodePort: 30001 under ports section

# In worker node, add the port 30001/tcp to the firewall
firewall-cmd --add-port=30001/tcp --permanent
systemctl restart firewalld

# !!! Still not working unless disable the firewall:
systemctl stop firewalld

# Apply the dashboard deployment again
kubectl apply -f recommended.yaml
Hello Pod
既然 Cluster 準備好了,就要deploy 一個Pod試一試。
Prepare the service and deployment yml. This YAML has a service and deployment with 2 POD (replicas). The yml is named: nginx-hello.yml
apiVersion: v1
kind: Service
metadata:
  name: nginx-service
spec:
  selector:
    app: nginx
  ports:
  - protocol: TCP
    port: 80
    targetPort: 80

---

apiVersion: apps/v1
kind: Deployment
metadata:
  name: nginx-deployment
spec:
  selector:
    matchLabels:
      app: nginx
  replicas: 2
  template:
    metadata:
      labels:
        app: nginx
    spec:
      containers:
      - name: nginx
        image: nginx:alpine
        ports:
        - containerPort: 80
Apply it:
# Apply yaml on control-plain node
kubectl apply -f nginx-hello.yml

# Check the deployment
kubectl get deployment

# Check the service
kubectl get service

# Check the pod, note that 2 pod should be running on node-1 and node-2
kubectl get pod -o wide

# Since the cluster IP cannot be accessed yet, let's start port-foward
kubectl port-forward svc/nginx-service 80:80

# Start another SSH session  control-plain node
curl http://localhost

# A html will be returned.
However, the service IP cannot be reached. I need to solve it. I can try MetelLB after.